Vector field visualization
by Vojtěch Tomas (@vojtatom), 2017 (update 2023), vector field visualization
I developed a prototype of a framework for 3D visualization of vector field data . The main focus was the visualization of plasma flow near solar surface. It was originally a semestral project that I later developed into a bachelor thesis at FIT CTU in Prague in cooperation with Michal Švanda and ASU CAS, supervisor Radek Richtr. The prototype was implemented using C++, Python, JavaScript and WebGL.
- links
- github repo
- thesis
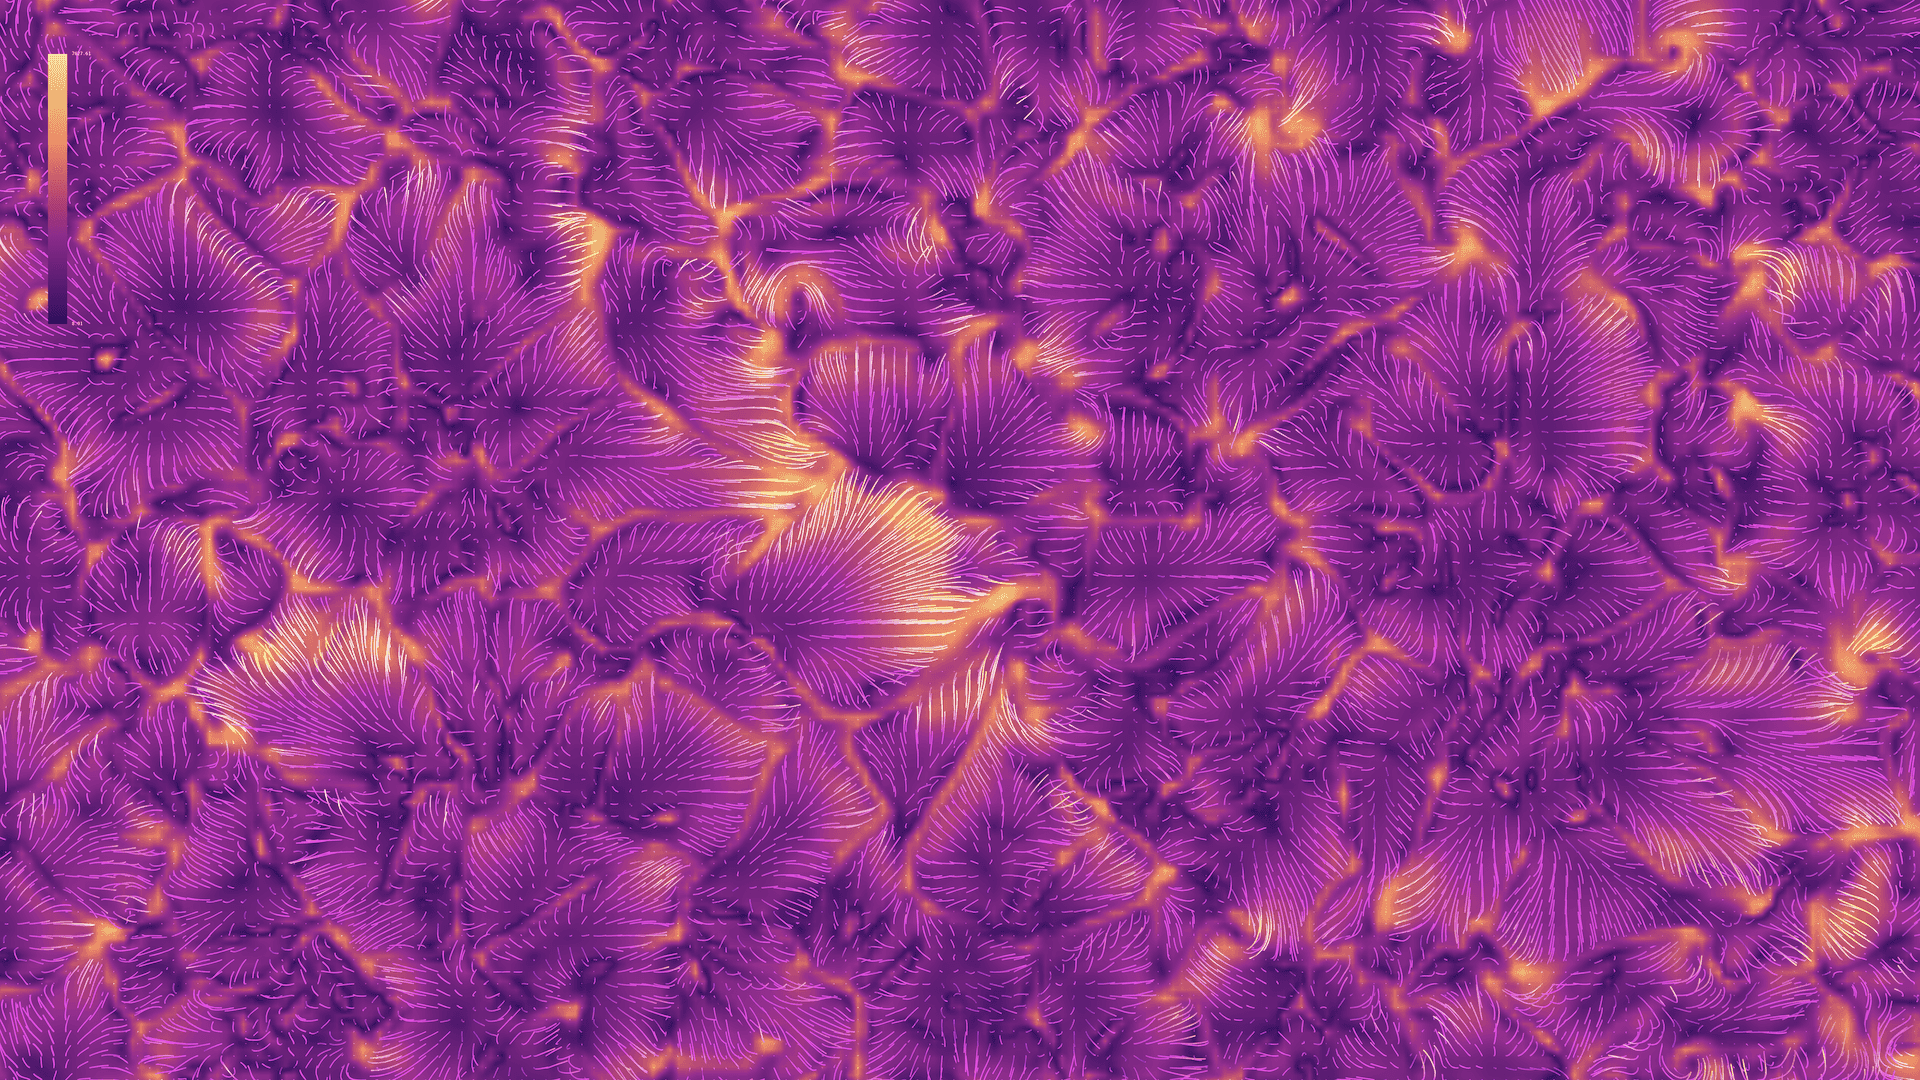
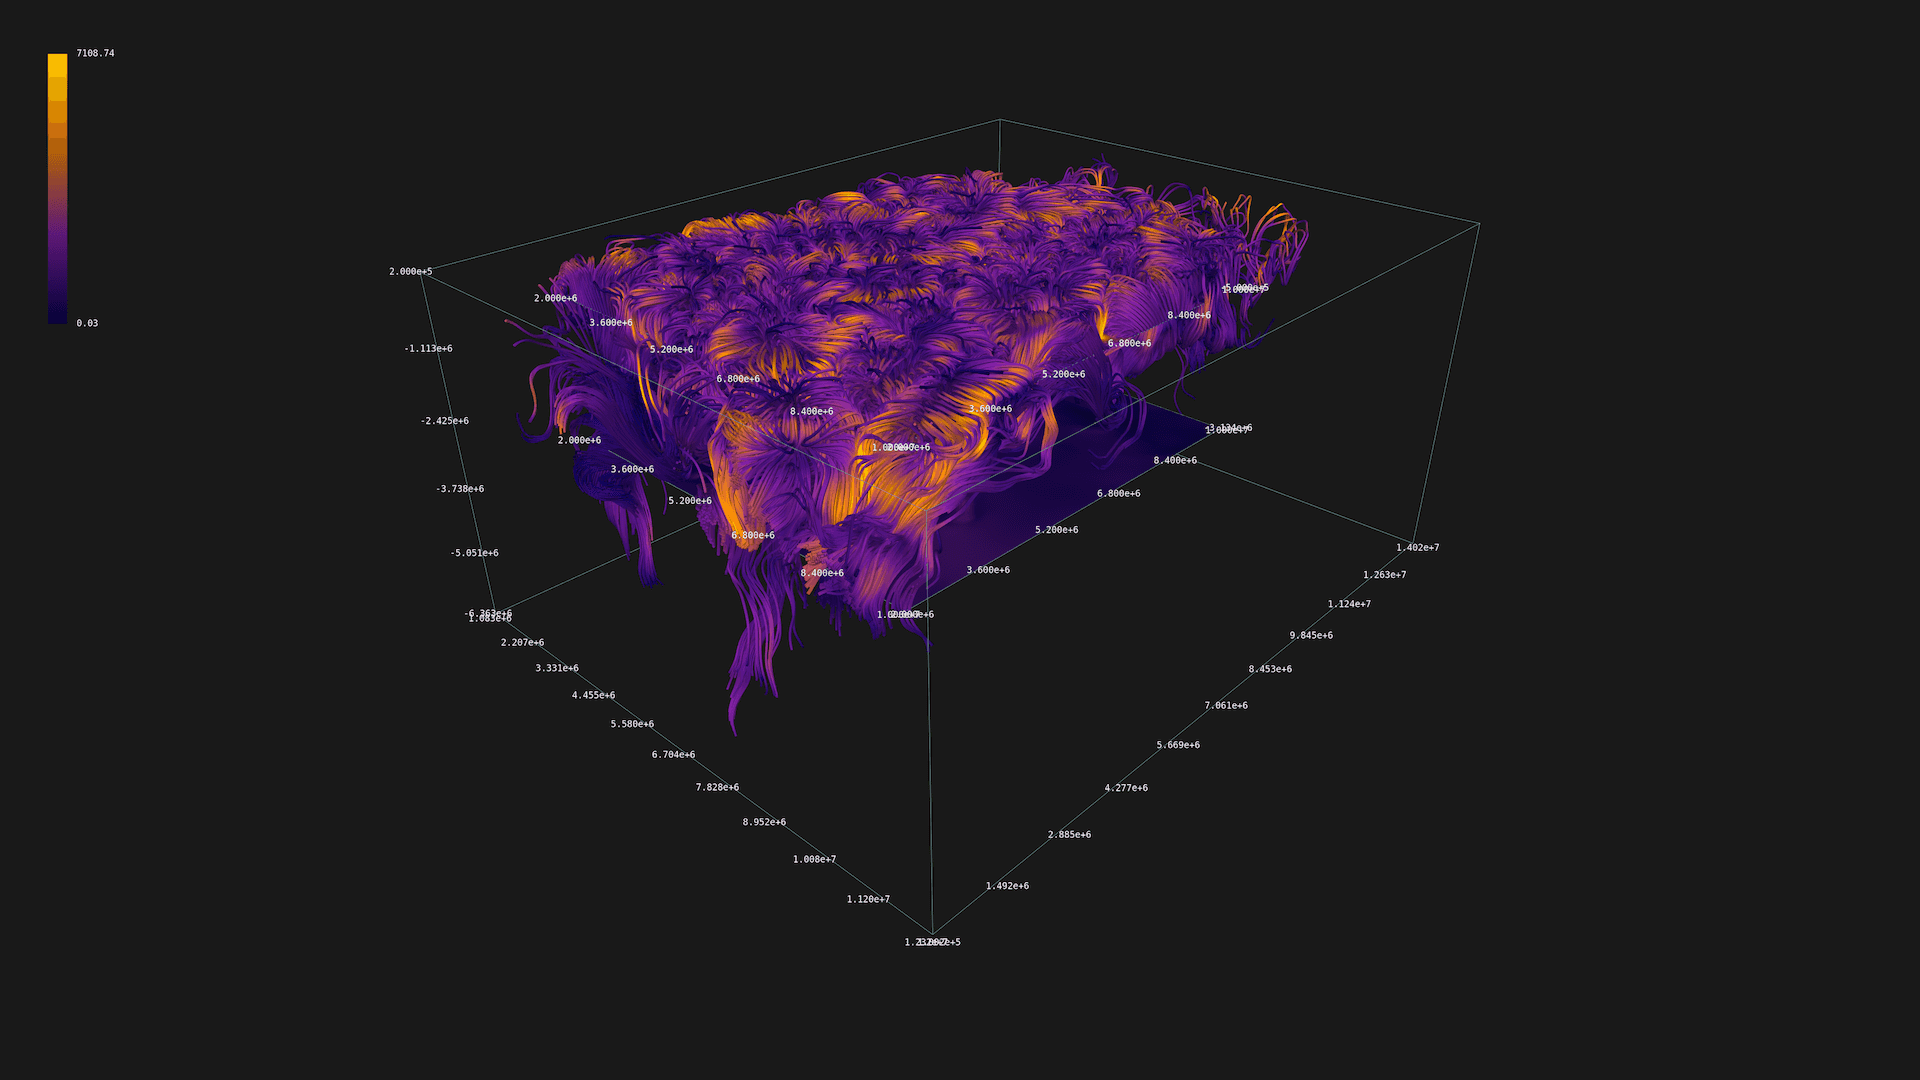
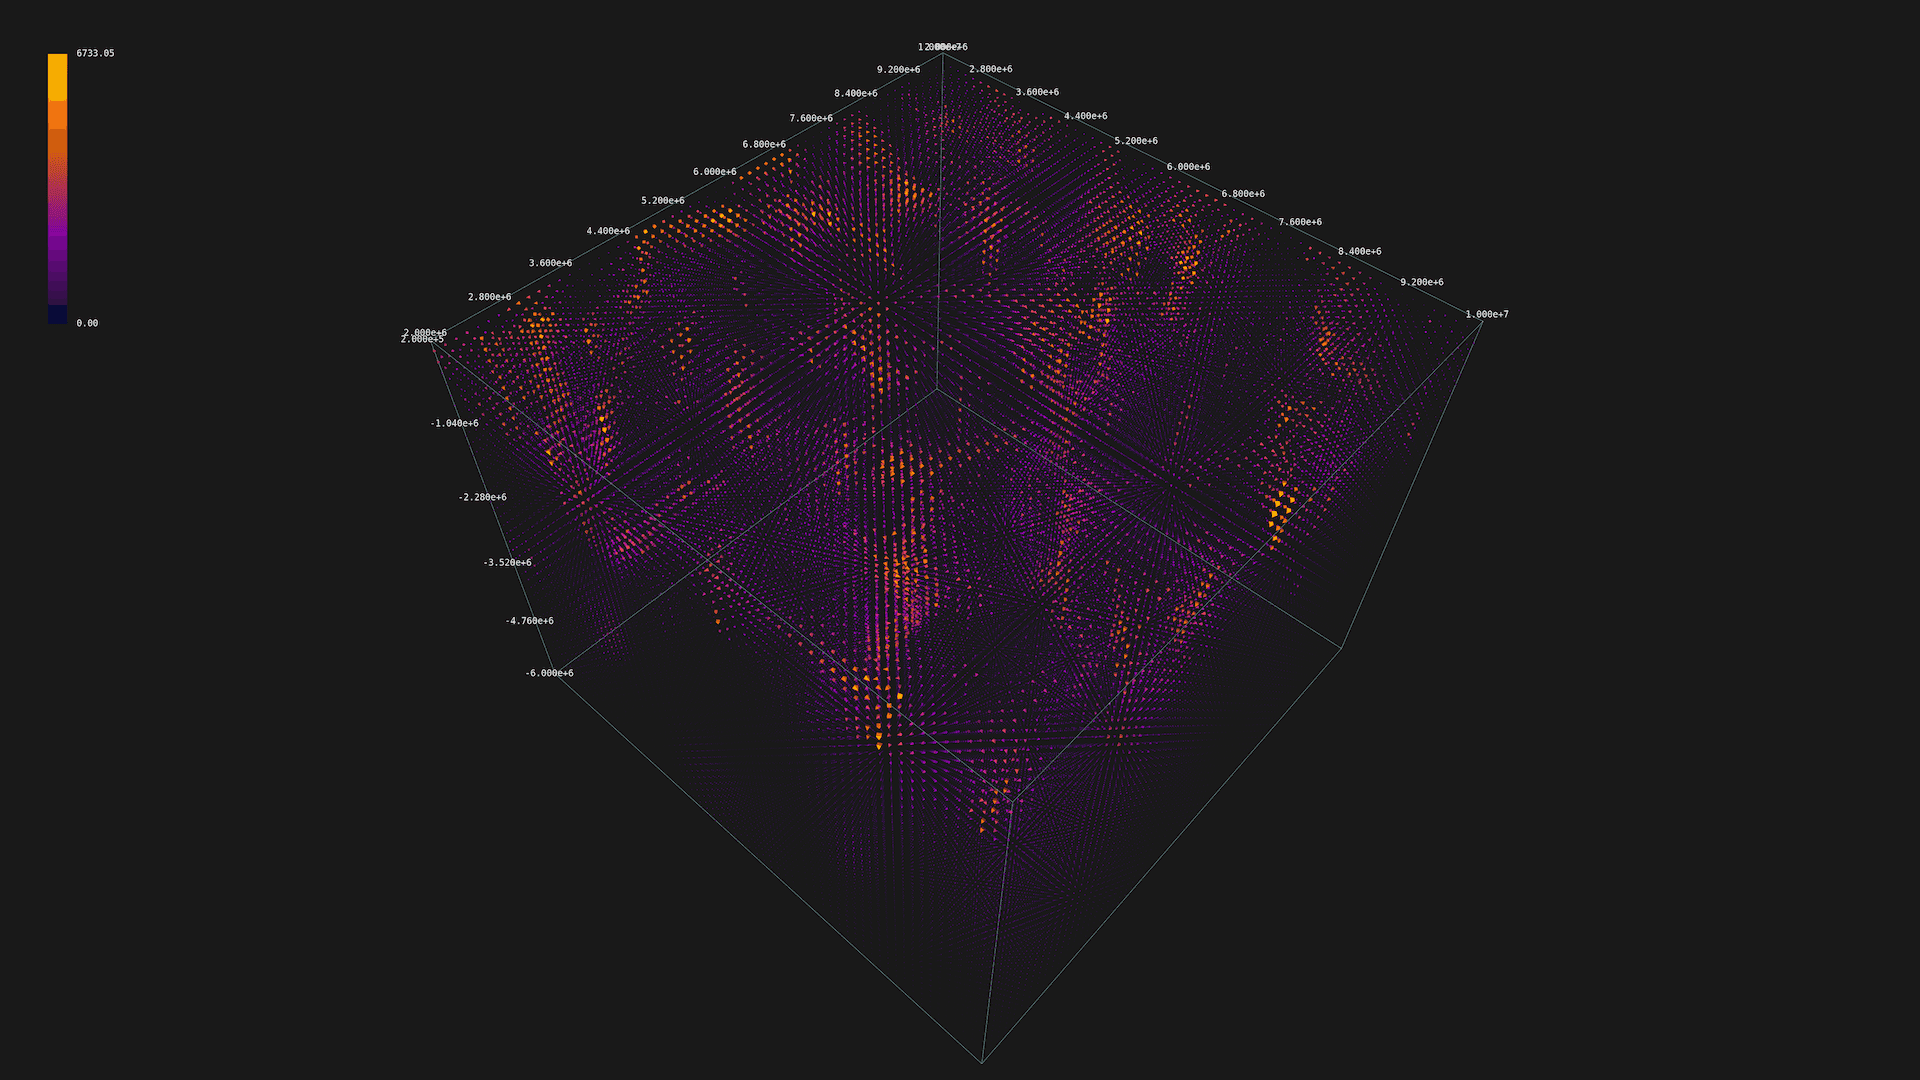
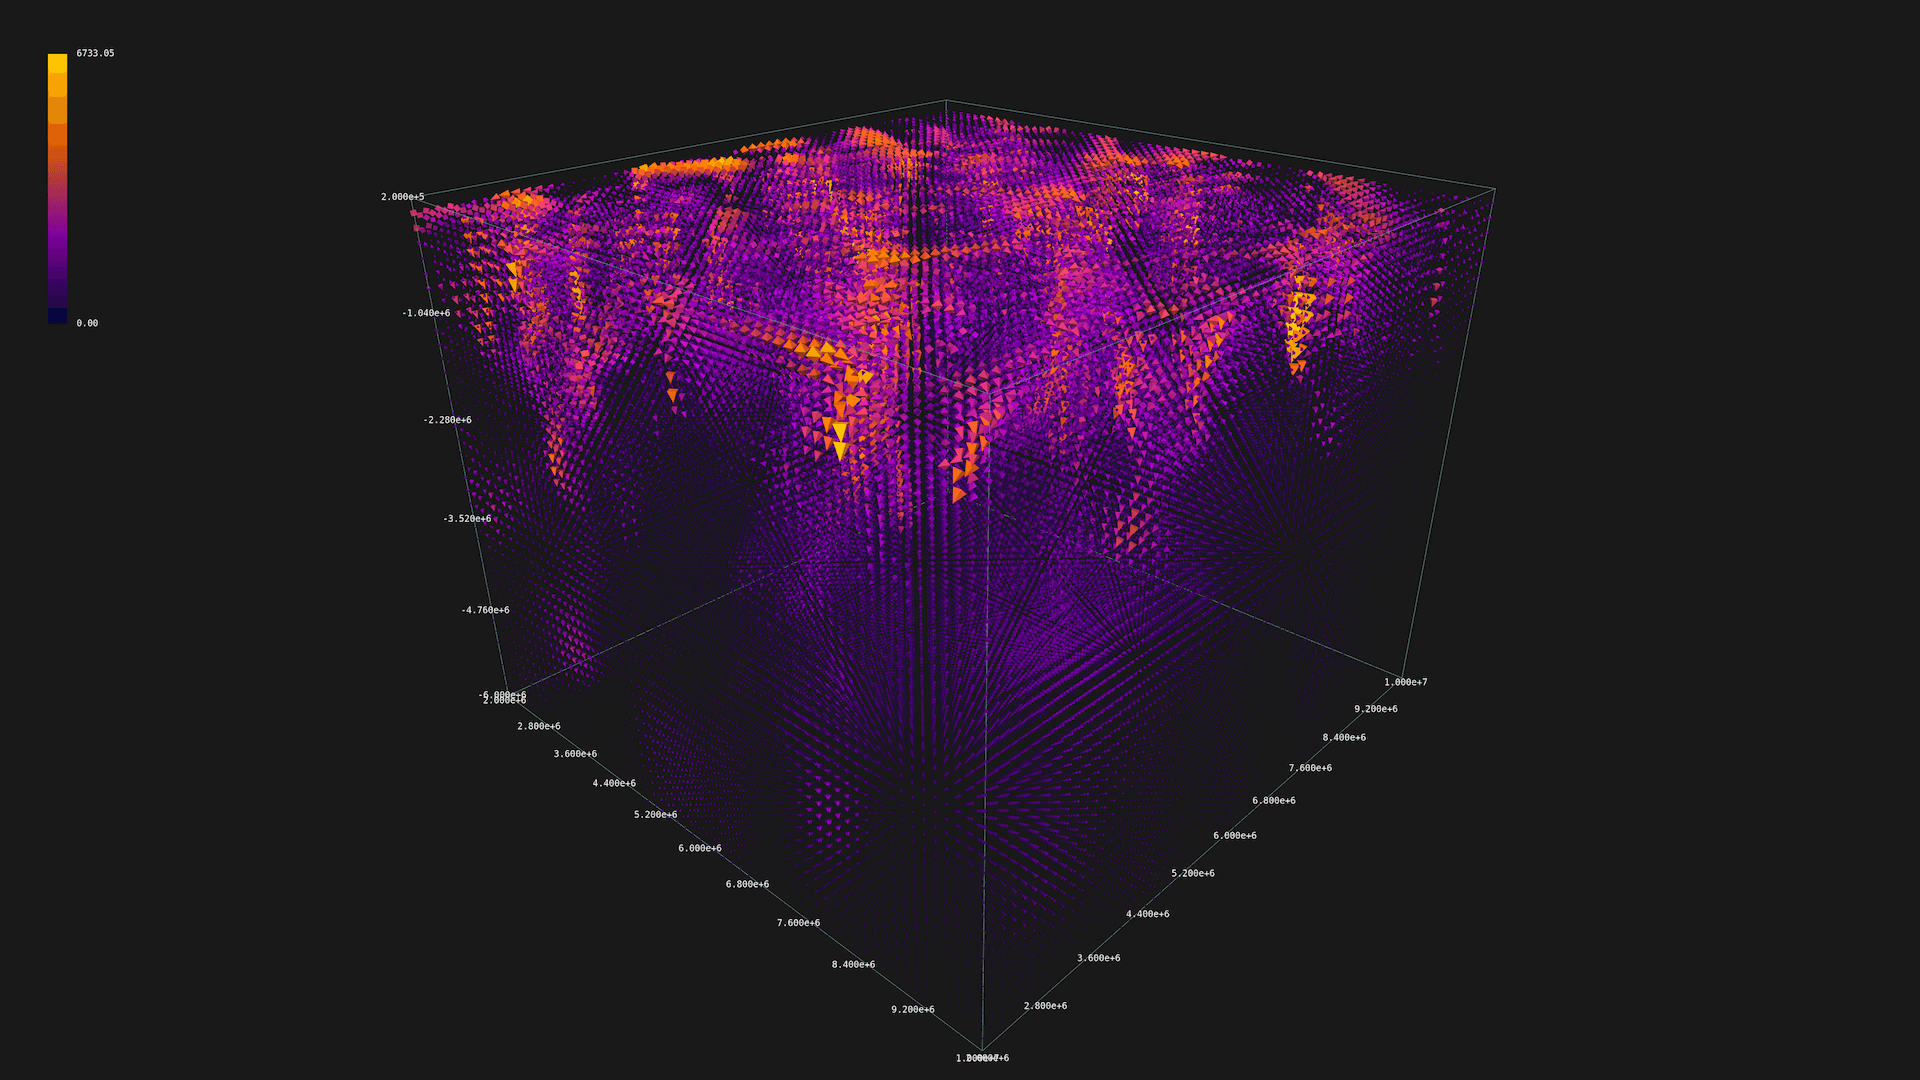
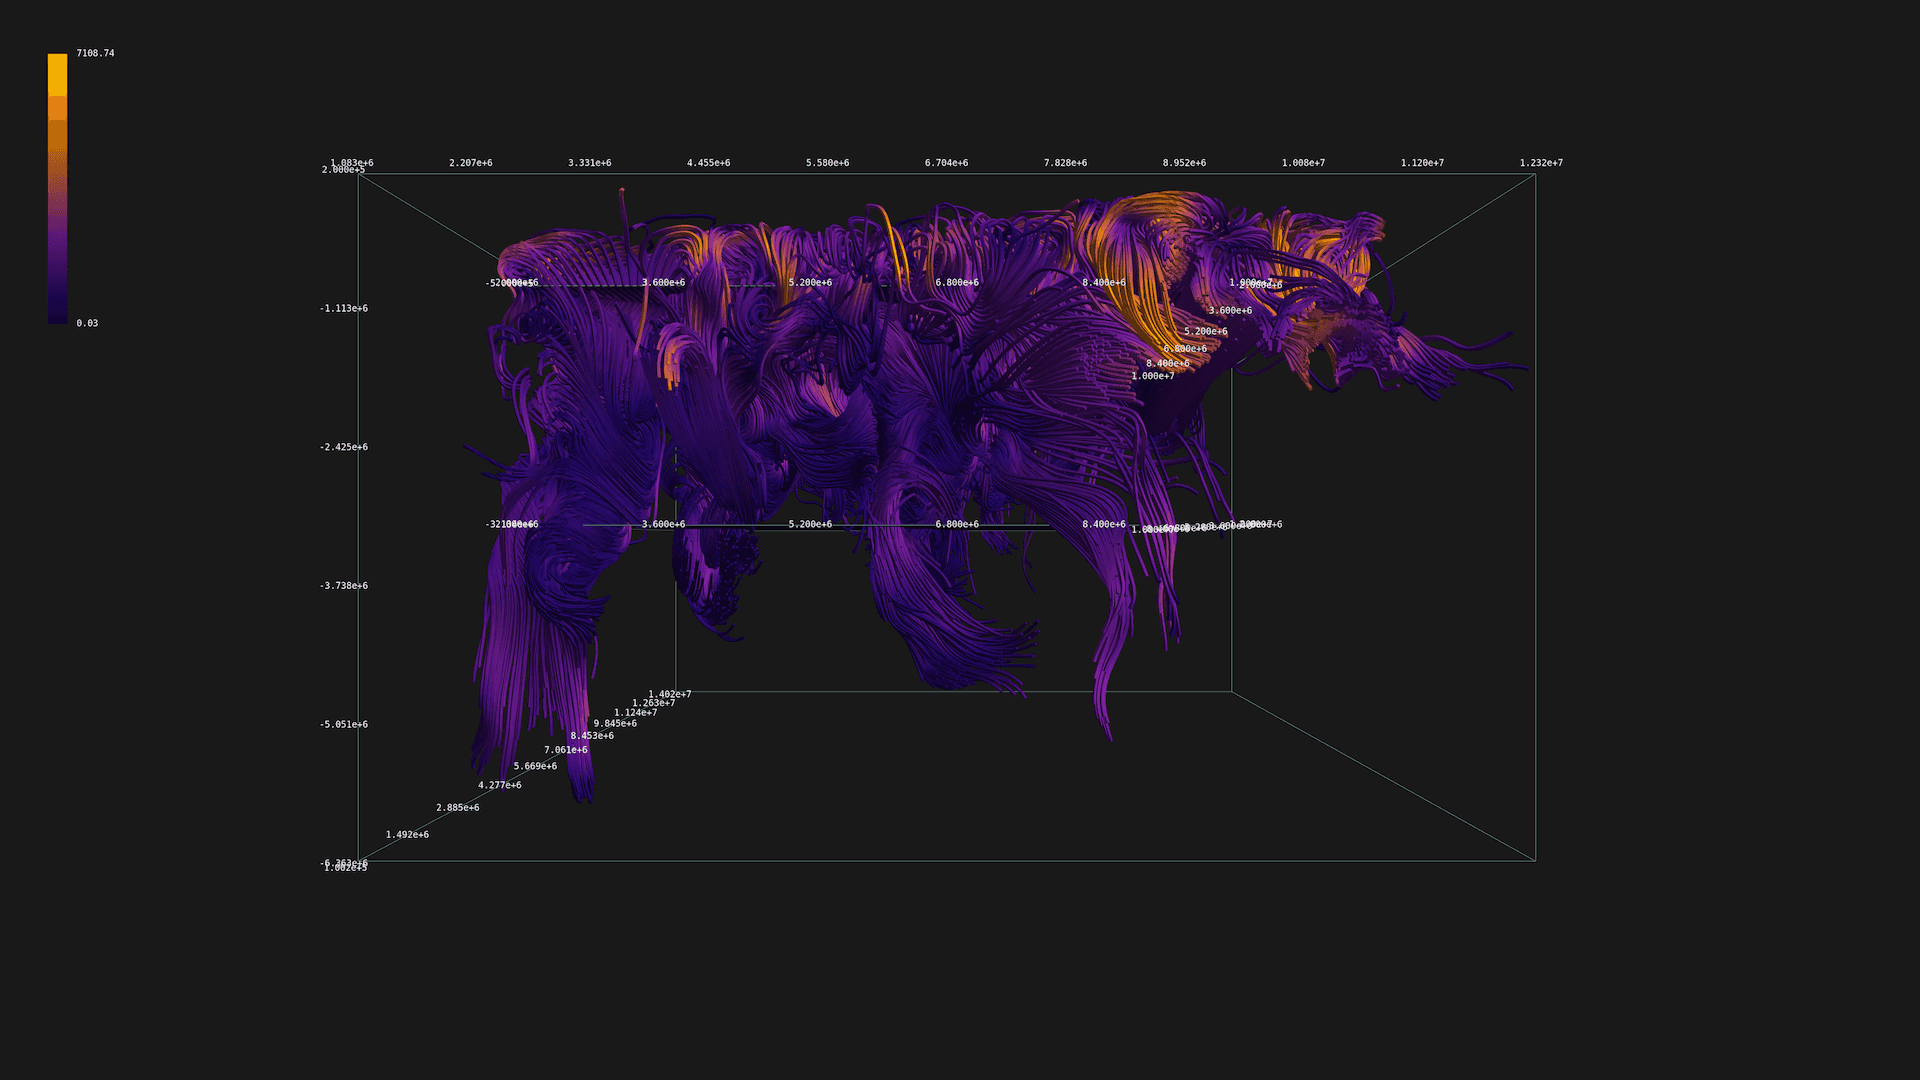
visualization of plasma flow using streamlines and colored cut plane
The final workflow is straightforward:
- preprocess the data in python using our own numflow package
- visualize the data using interactive web app
numflow package
The numflow package is mainly written in C++ and Python, the interoperability is ensured by pybind11.
As supprted input format, I explored several options including FITS, several VTK formats, custom binary formats and plain CSVs. As mentioned, the project was developed in cooperation with ASU CAS, and using simple plain CSVs proved to be the most convenient - the time spent on debuging various parsers was not worth the time saved by using more efficient formats.
The package supports data aligned to rectiliner grids, however the input format was just a list of positions and velocities:
x,     y,      z,      vx,    vy,    vz
0.10,  0.10,   0.50,   0.20,  1.99,  0.50
0.10,  0.10,  -0.58,   0.20,  1.99, -0.58
0.10,  0.10,  -1.66,   0.20,  1.99, -1.66
...
60.00, 60.00, -17.84, -0.61, -1.90, -17.84
60.00, 60.00, -18.92, -0.61, -1.90, -18.92
60.00, 60.00, -20.00, -0.61, -1.90, -20.00
I made a short Python notebook with example pipeline . The user can parse the data using the following code:
from numflow import Dataset
field = Dataset("path/to/data.csv")
print(field.info())
The package then exposes a visualization object, that can be used to preprocess the data:
from numflow import Visualization, points, random_points
vis = Visualization()
visualization of plasma flow using colored cut plane and streamlines
The user can then use the visualization object to add layers:
# generate 1000x1000 points on plane
layer_z = -10
layer = points([20, 20, layer_z], [590, 590, layer_z], [1000, 1000, 1])

# use those points to add a color-mapped layer (cut) to the visualization
vis.layer(field, layer)
One of the main features of the package is the ability to compute streamlines - the package includes a custom RK4 solver implemented in C++, which beats the performance of the SciPy Python implementation by several orders of magnitude (see thesis).
# generate 200x200 points on plane
layerS = points([20, 20, layer_z], [590, 590, layer_z], [200, 200, 1])

# use those points as seeding points for streamlines
vis.streamlines(field, layerS, tbound=0.01, size=0.2, appearance='transparent', sampling=3, divisions=3)
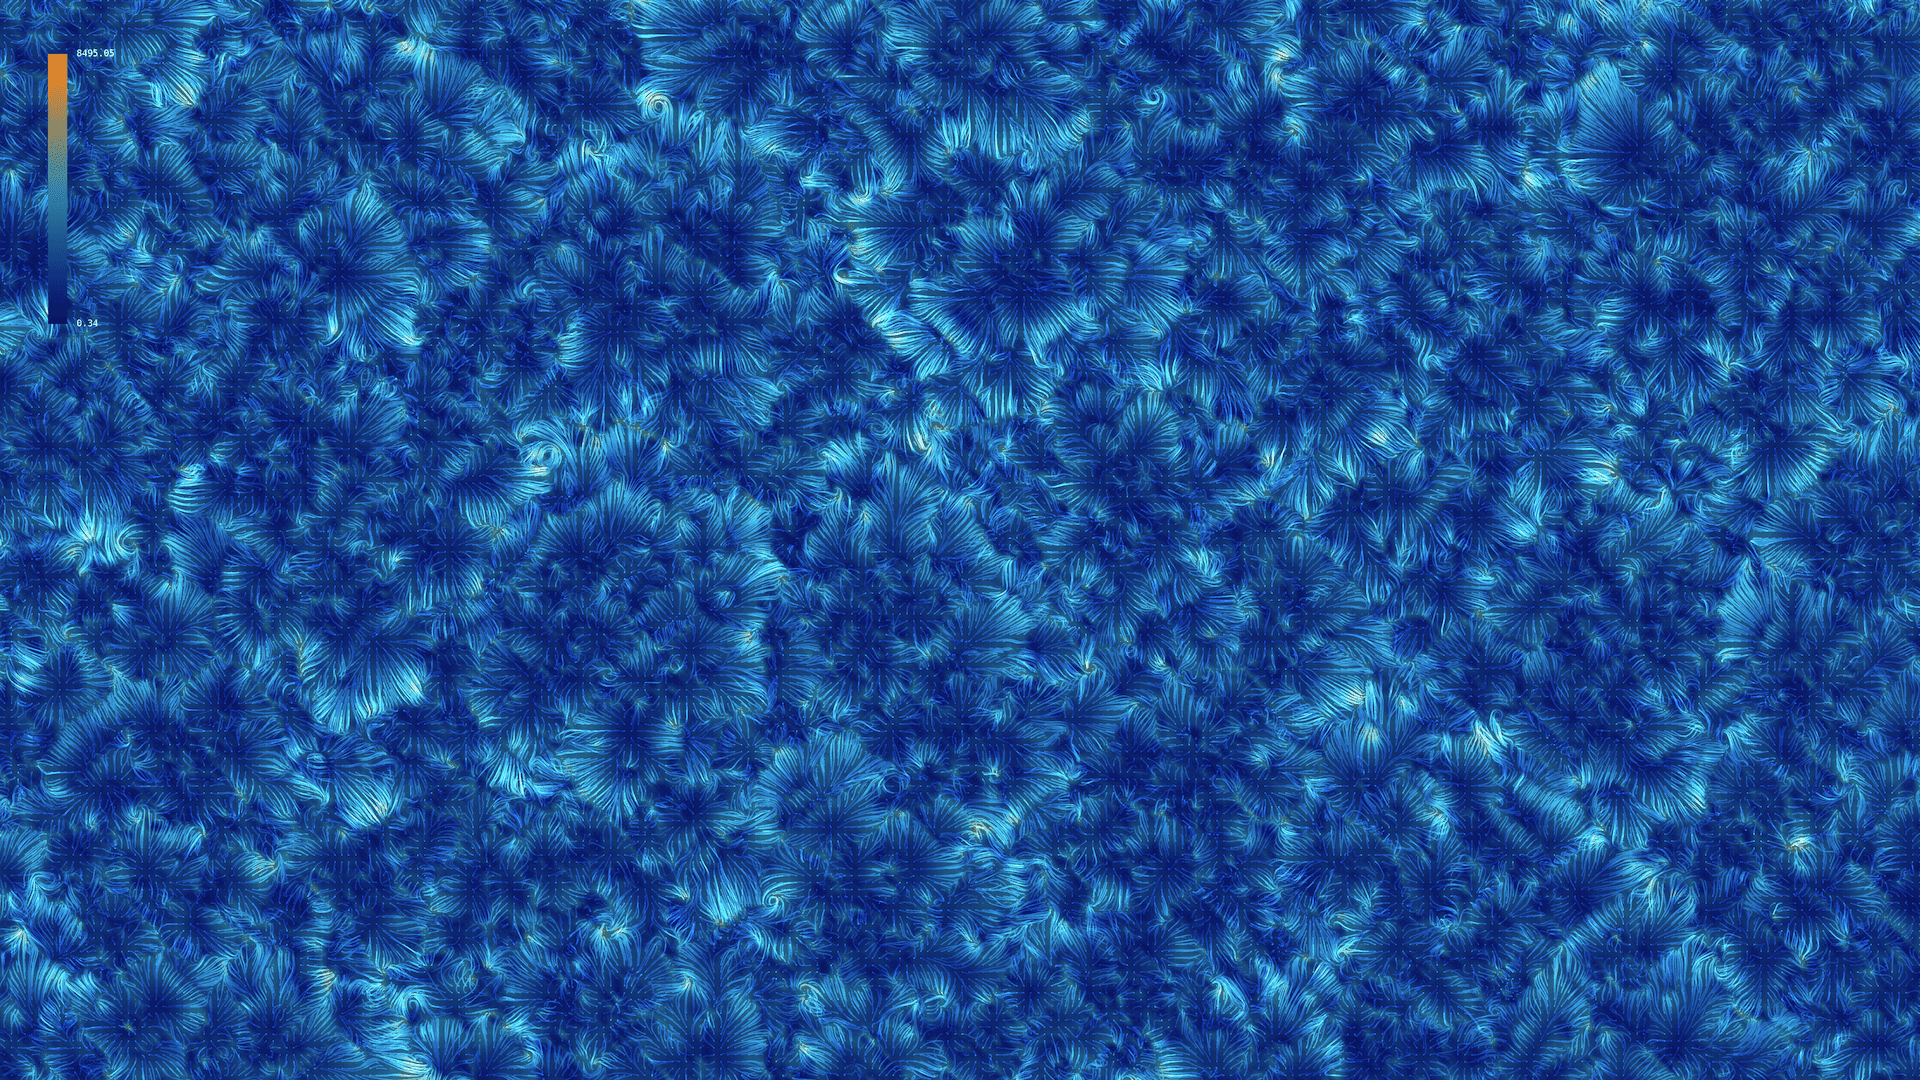
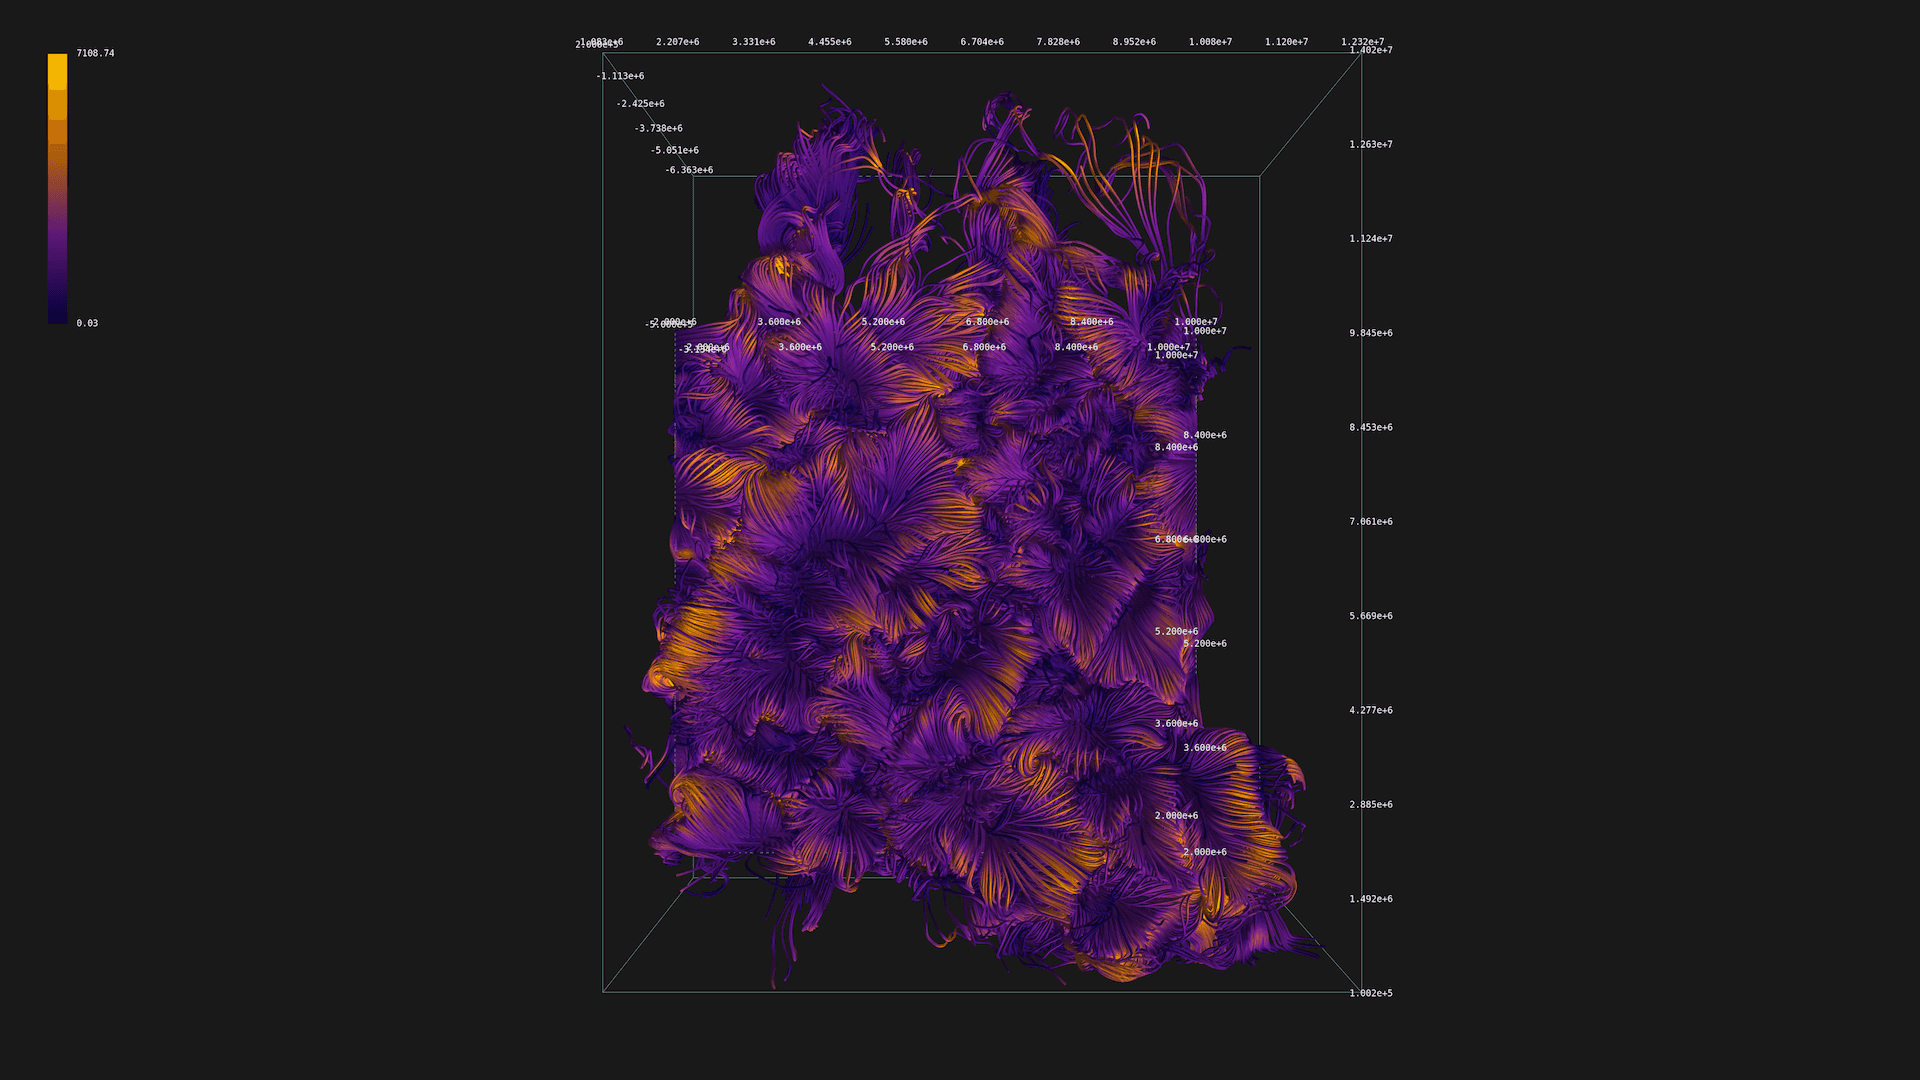
visualization of plasma flow using glyphs
The package also includes a simple glyph interpolator. Note that the seeding points are generated randomly:
# generate 200 * 200 * 10 random points on plane
randomS = random_points([20, 20, layer_z], [590, 590, layer_z], 200 * 200 * 10)

# use those points as seeding points for glyphs
vis.glphys(field, randomS, size=0.2)
At the end, the pre-processed data gets saved to a JSON file:
vis.save("path/to/output.json")
WebGL application
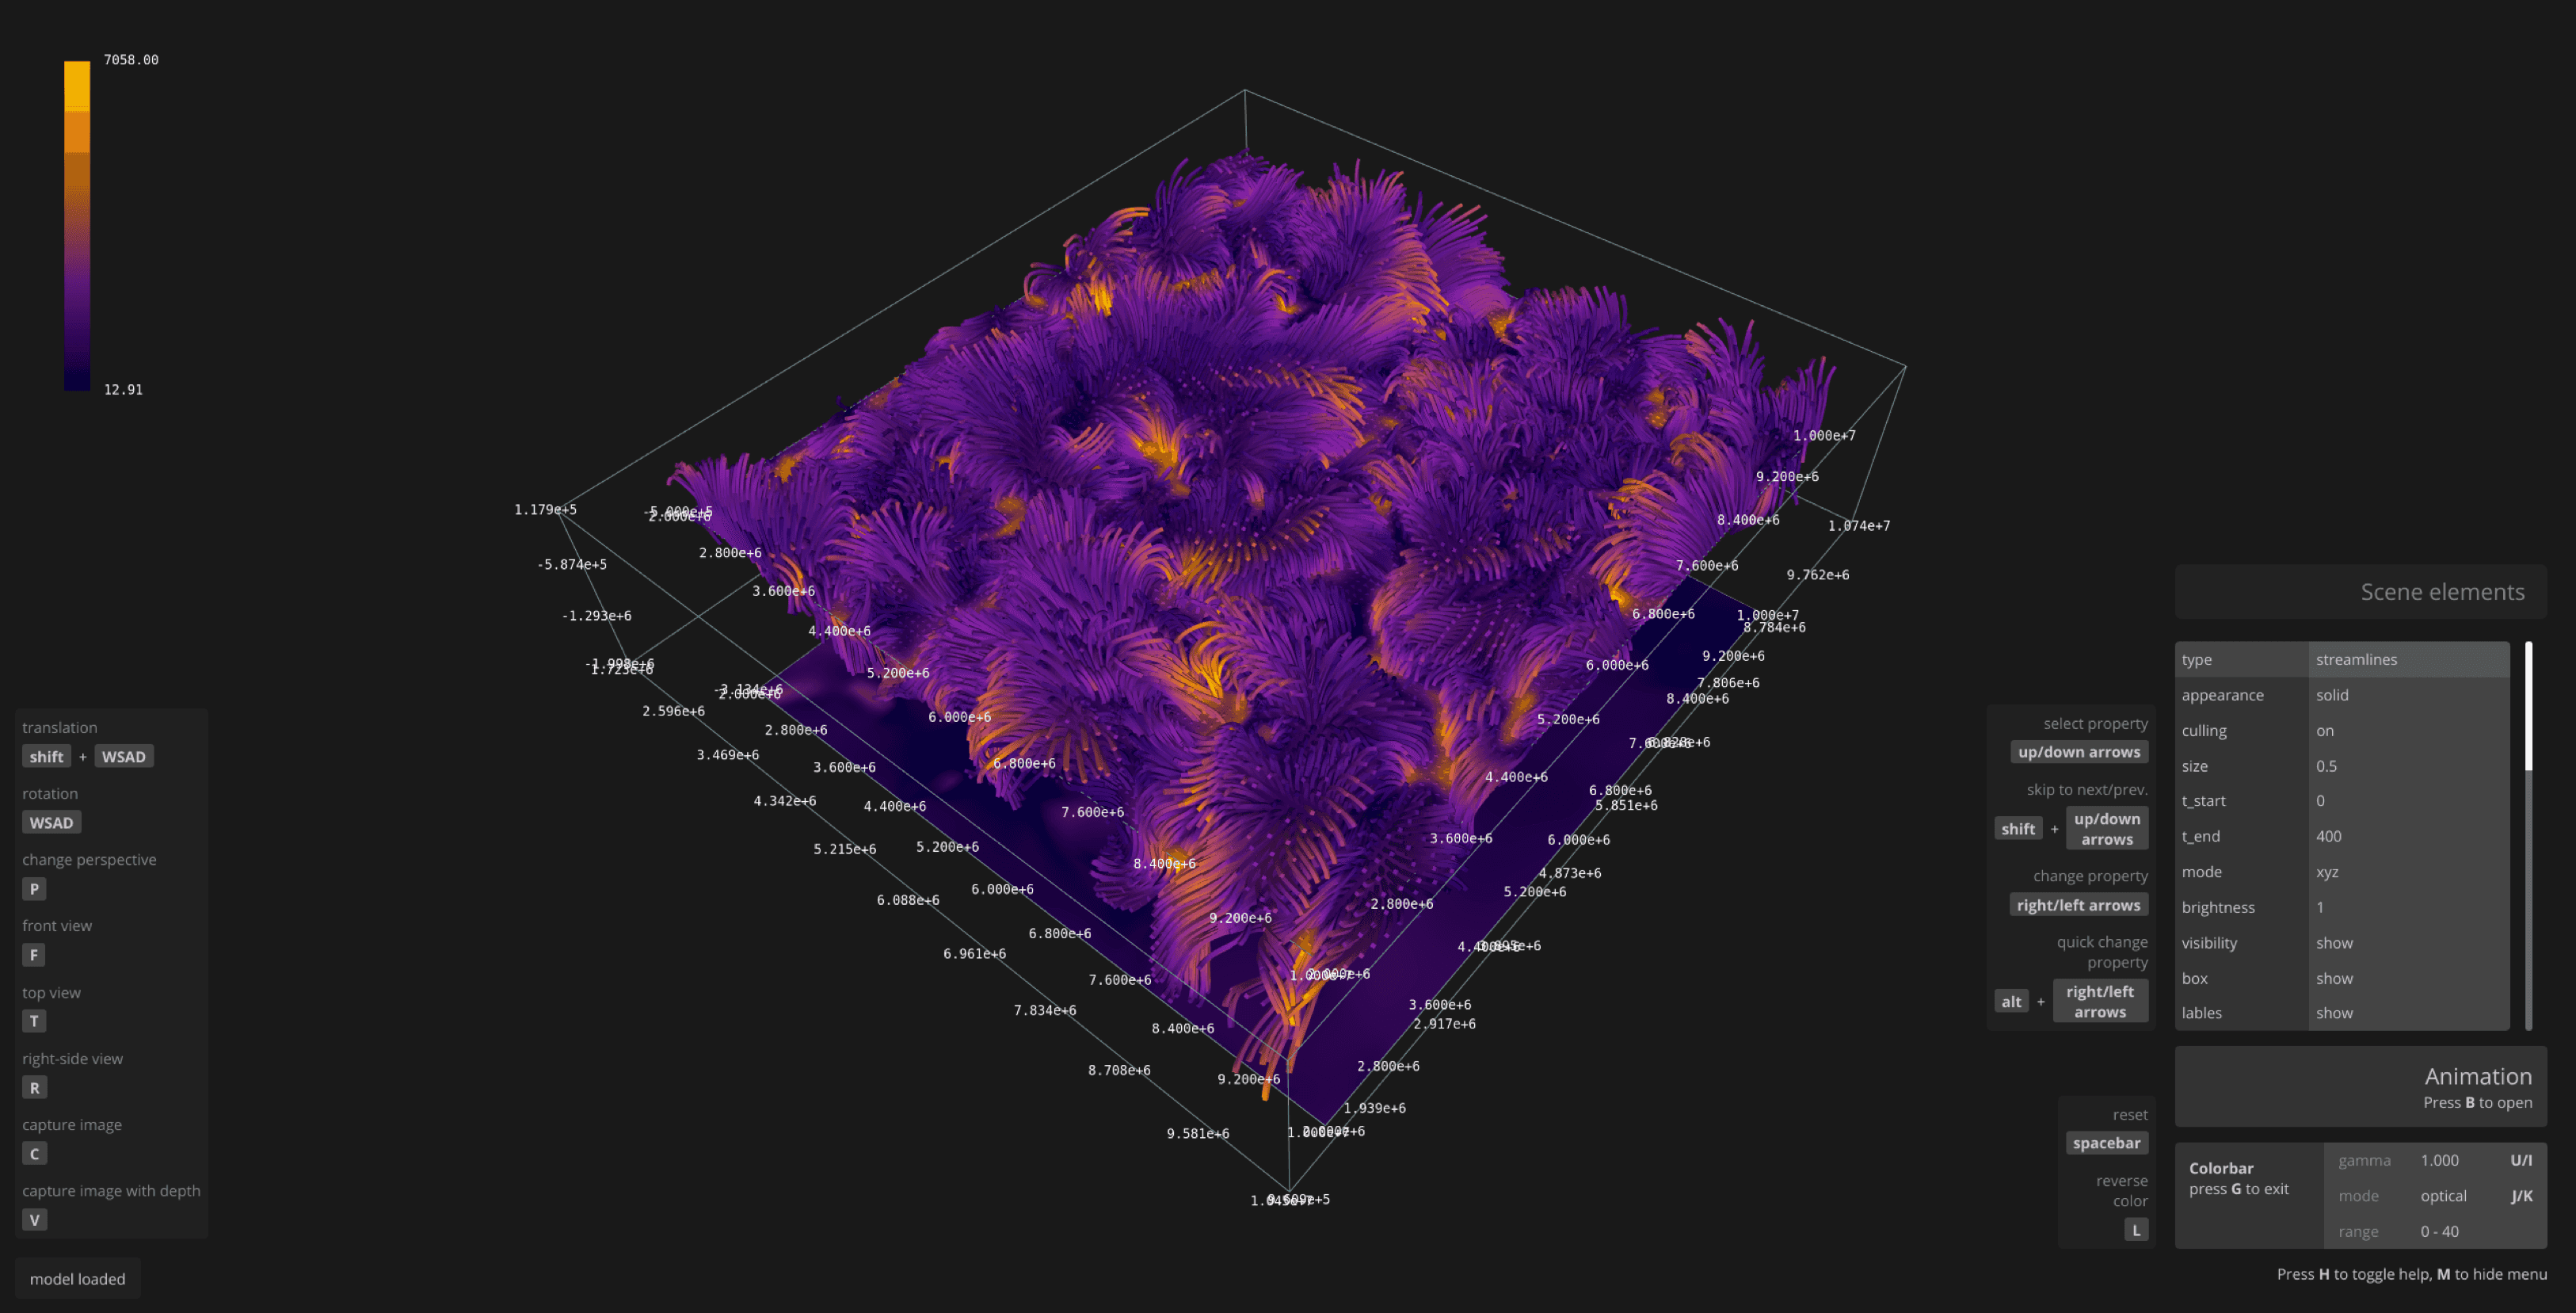
WebGL application for visualization of plasma flow
The application was written in plain JavaScript and WebGL, no libraries, no frameworks. It is capable of loading the JSON file produced by numflow package and rendering the data. The application runs in the browser as well as in distributed environments such as SAGE2 wall.
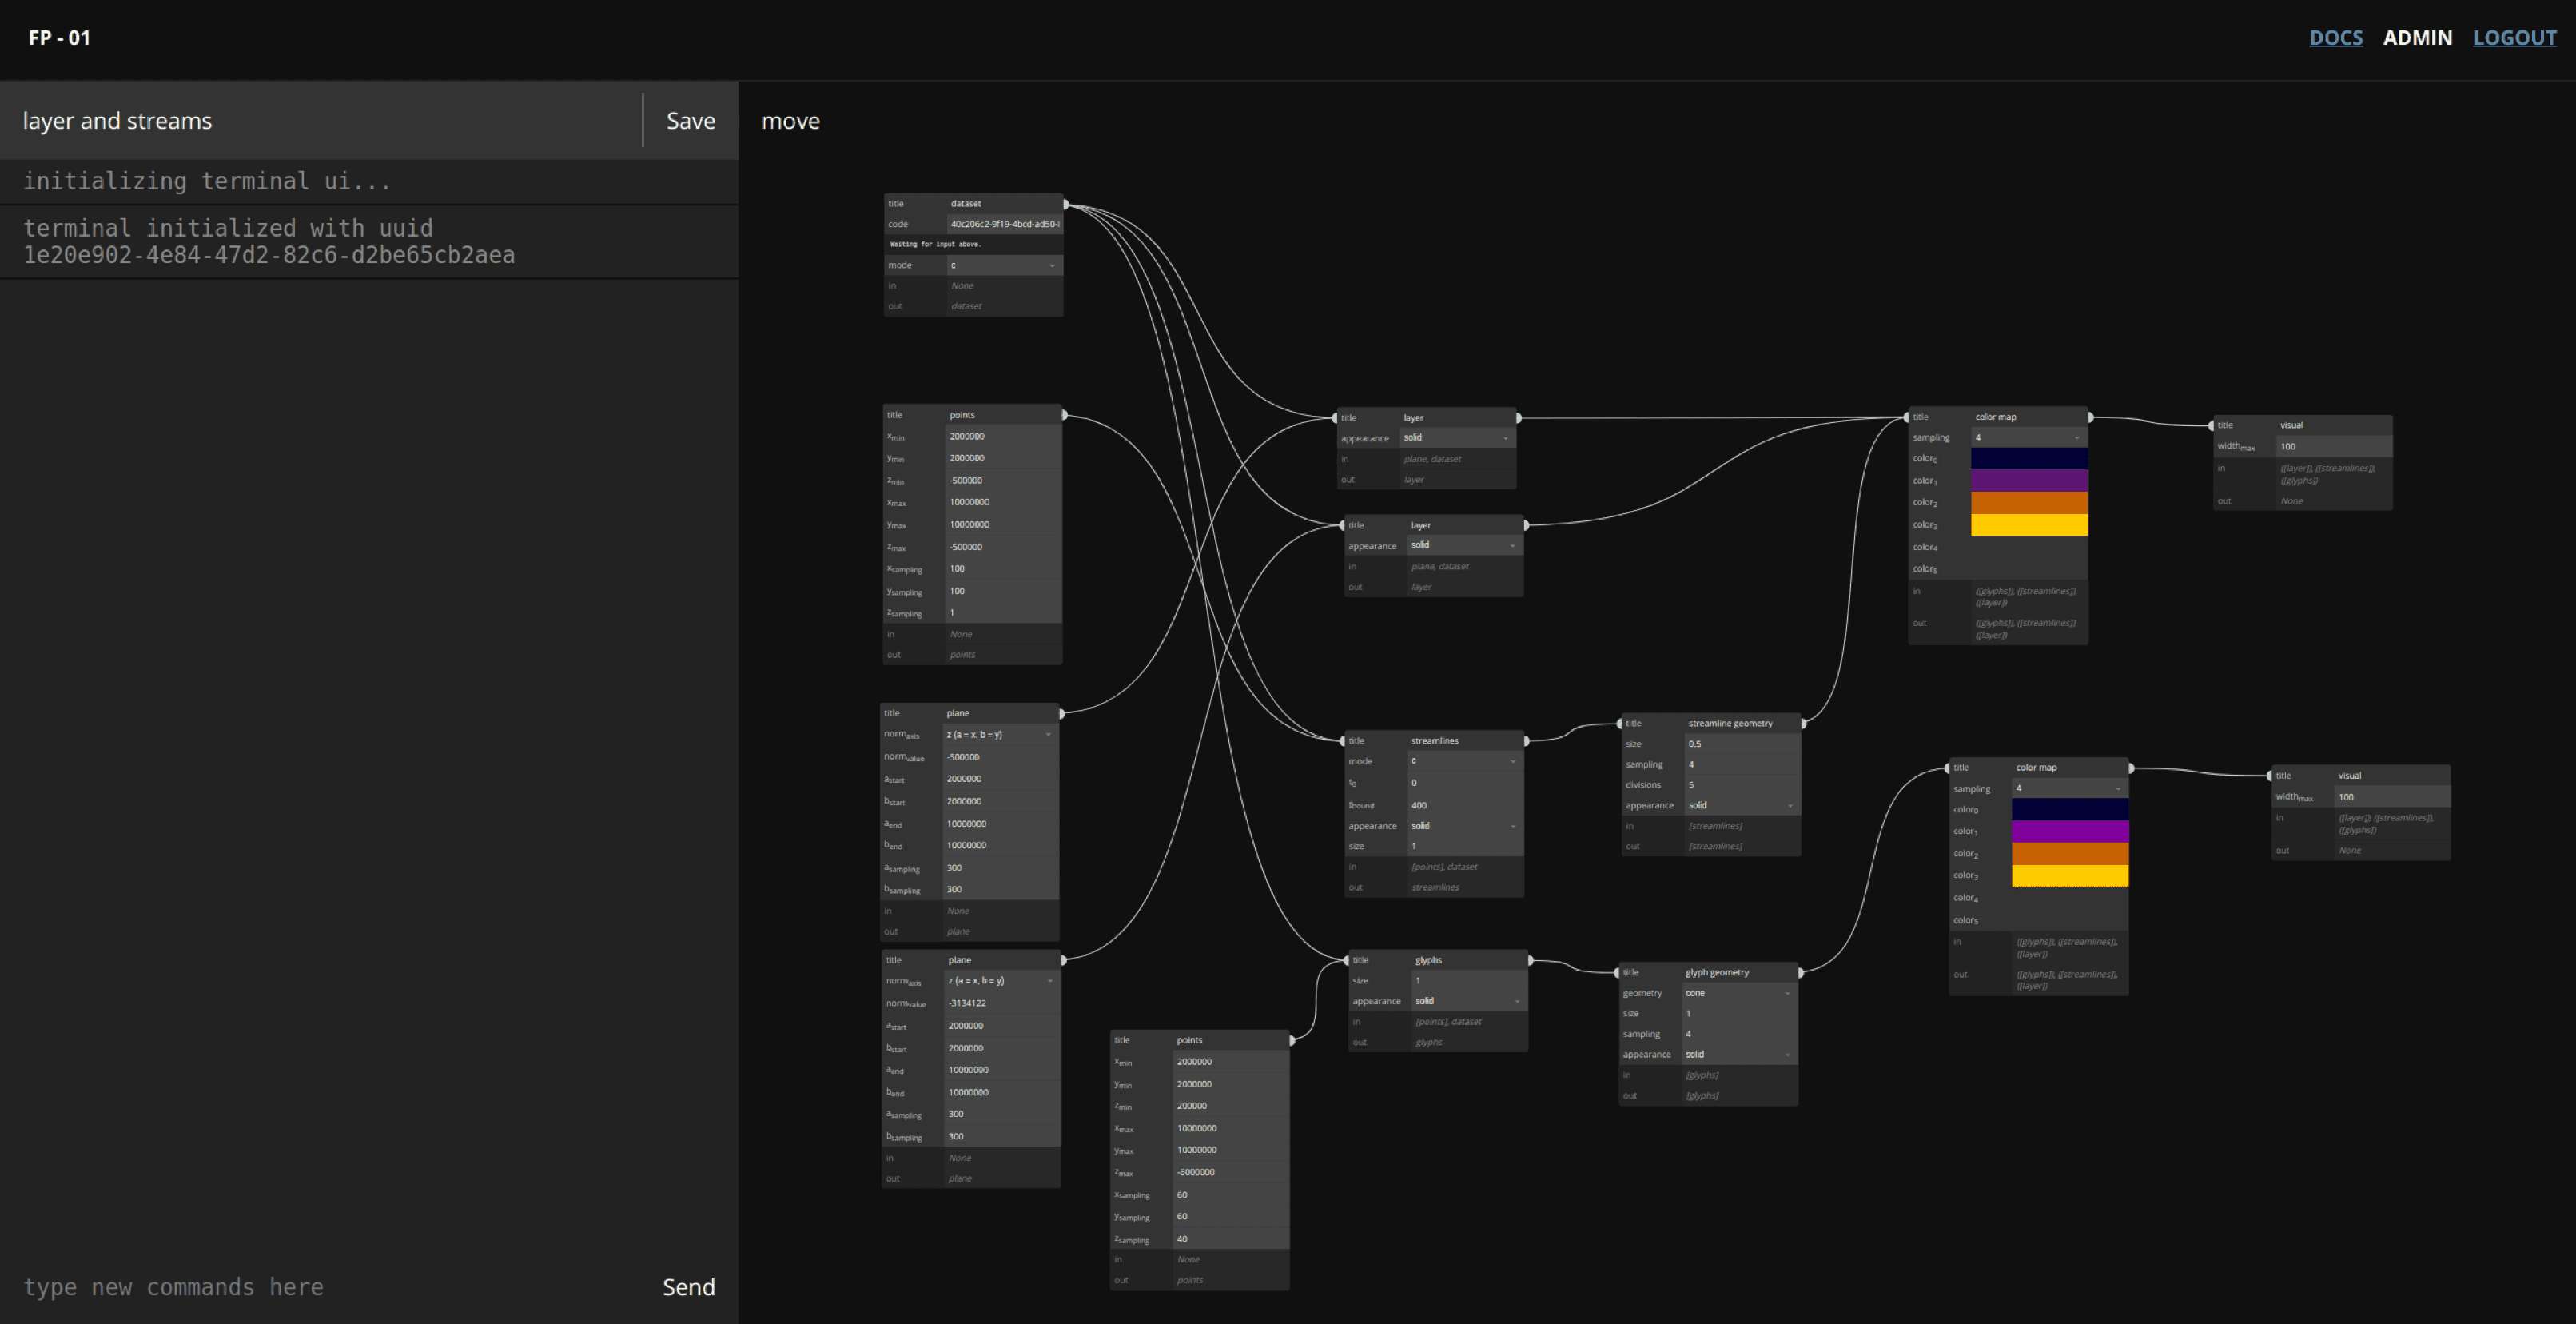
pipeline editor for defining the appearance of the layers
Now obsolete part of the application also included a simple pipeline editor, where the user could define the used layers and their appearance. Combination of multiple data sources was also supported.
Additional outputs
Conclusion
If you are interested in the project, you can find the source code on GitHub (numflow.py) and my bachelor thesis on DSpace CVUT . I intend to release the numflow package as a standalone library to PyPI (currently work in progress - last update Dec 2023). Regarding the WebGL application, the source code is available as well, since it is bare JavaScript, it still works; however, I don't plan to maintain it. It would be interesting to reimplement the application using modern tools and libraries. Also mail me or tweet @vojtatom (me) if you decide to make something based on this!